~/case-studies

Fix reports.

Anonymized where the client asked. Each figure states its measurement period.

Source: our own client records, 2021 to June 2026. Crawl figures are medians across Retainer and Embedded clients after six months, measured from server logs, verified Googlebot only. LCP is Chrome UX Report field data at the 75th percentile, not a lab score. Results vary by site, stack and how quickly fixes ship.

INC-01 Home-goods retailer · Retainer, 6 months

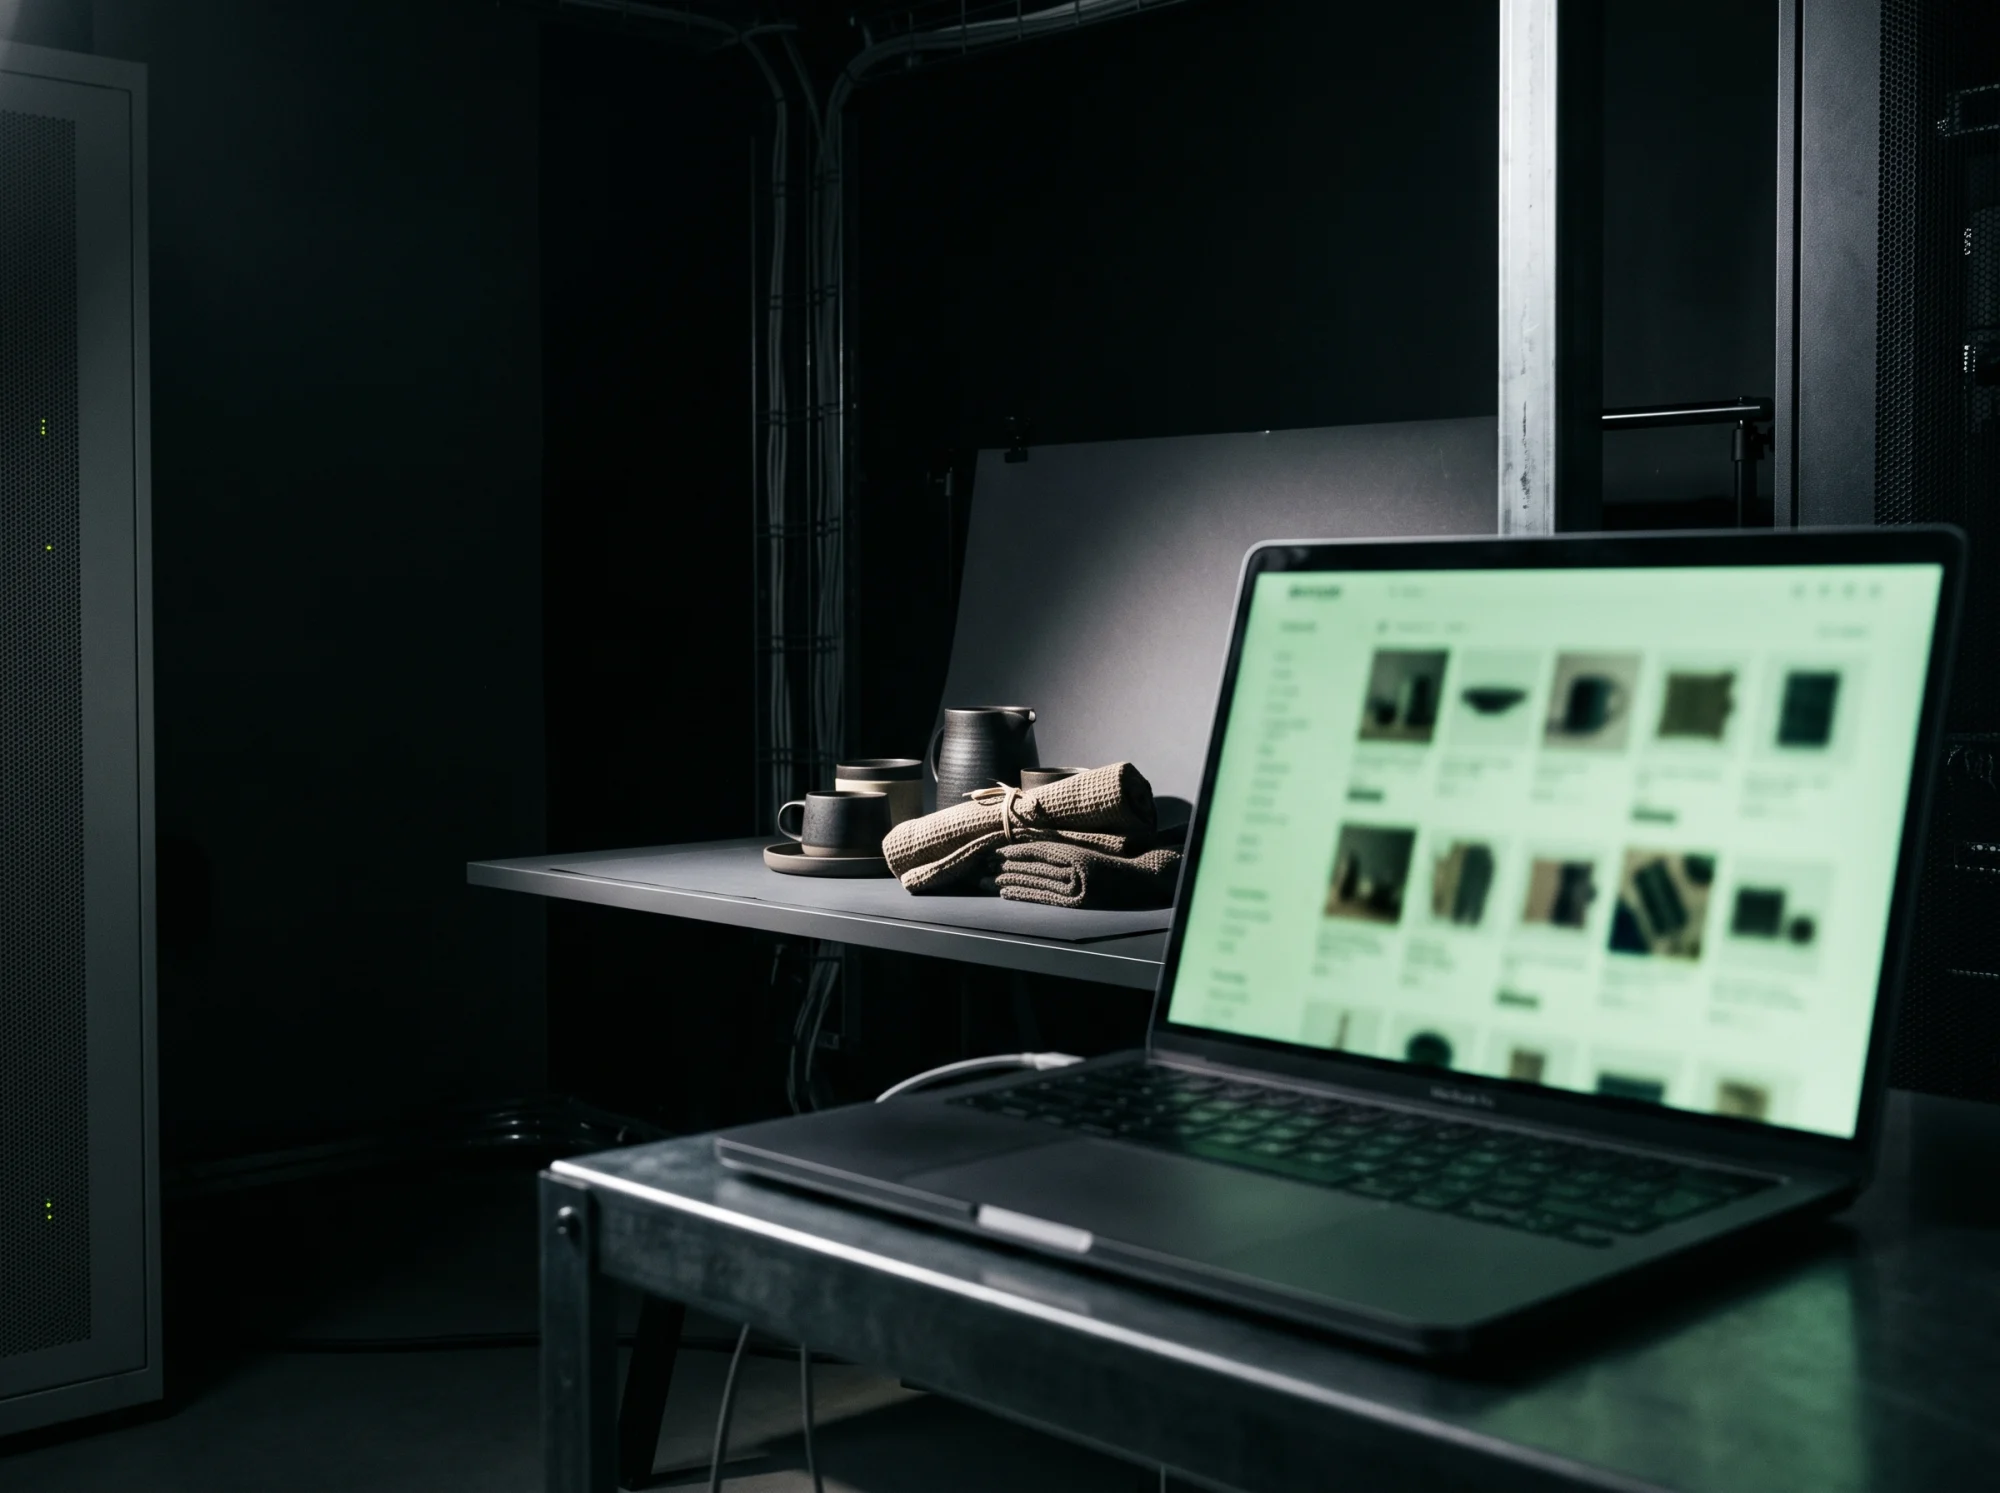
Six thousand product pages, none of them indexed

Googlebot was spending more than half its requests on sort and filter parameters. We wrote the facet rules and canonical fixes as tickets, the client's two developers shipped them over three sprints, and product templates moved to server rendering.

MetricResult
Wasted Googlebot requests−52%
Product pages indexed+5,700
LCP at p75, down from 4.1s2.6s
From audit to full fix6 mo
Six thousand product pages, none of them indexed
INC-02 Online store · Embedded, 4 months

A replatform that kept its traffic

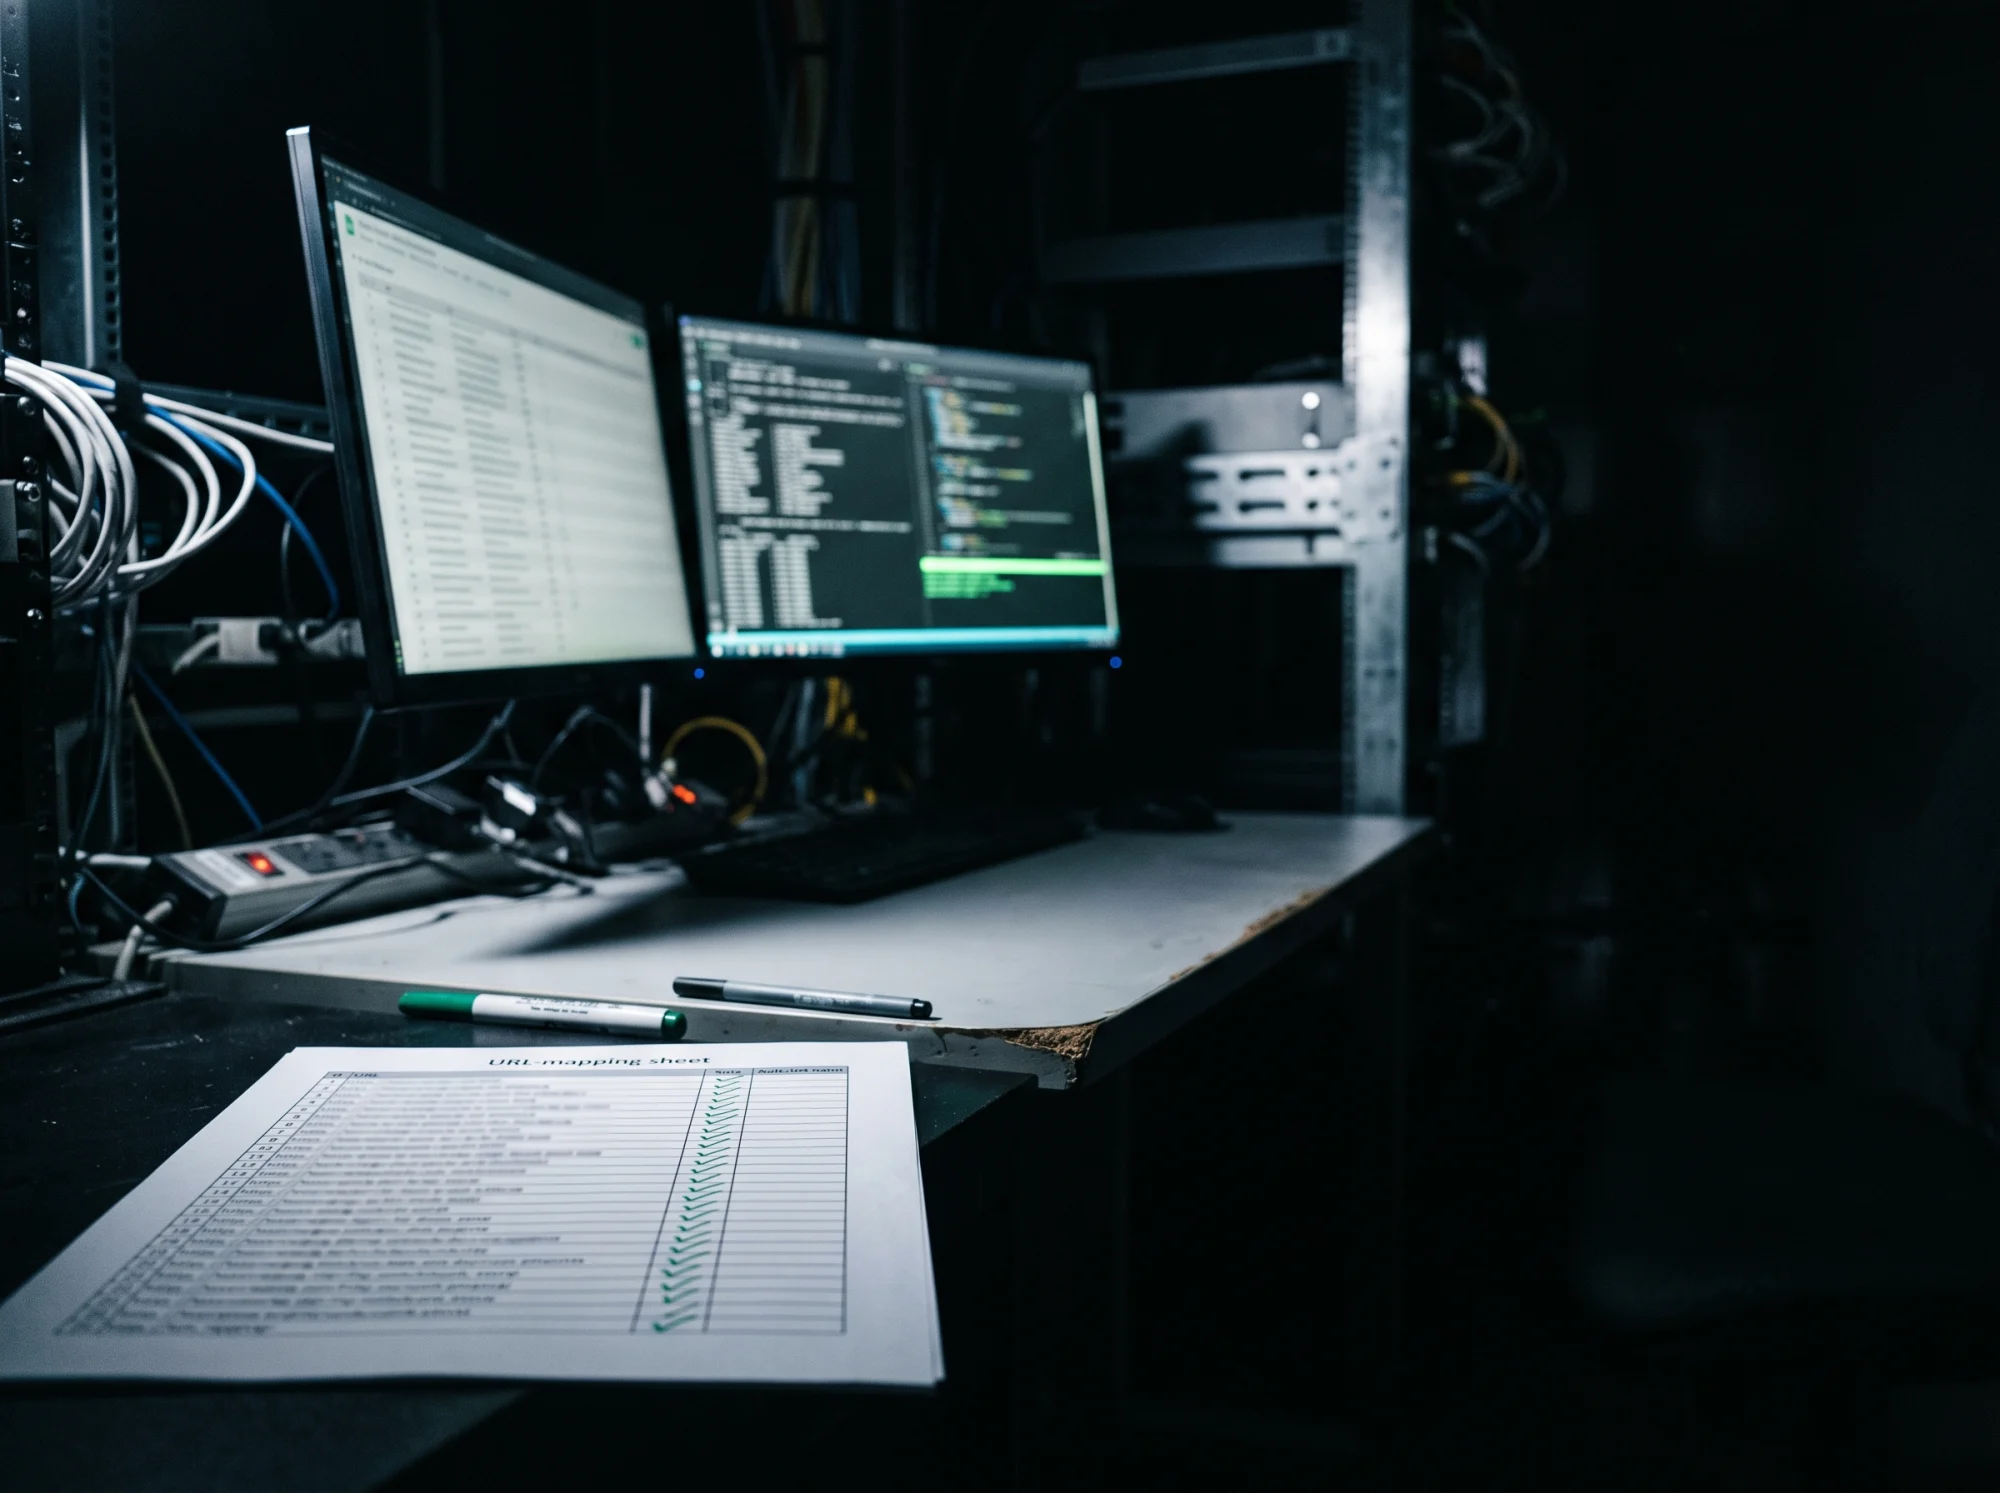
28,000 URLs changing shape in a move to a new platform. We mapped every legacy URL before launch, reviewed the launch releases on staging, and checked the redirects against the logs afterward. Organic traffic dipped for two weeks, then returned to its pre-migration level.

MetricResult
Back to pre-migration traffic14 days
Legacy URLs mapped and checked28,000
A replatform that kept its traffic
INC-03 Publisher · Retainer, ongoing

Core Web Vitals that survived a release cycle

Getting LCP down once is the easy part. Keeping it down through weekly releases took per-template tracking and a regression alert the client's team could act on within a day.

MetricResult
LCP at p75, from 3.8s2.3s
Without a regression on tracked templates9 mo
Core Web Vitals that survived a release cycle

Start with a crawl audit.

$160, fixed price, two weeks. Findings ranked by impact with the evidence attached, and the fee credited against your first month if you continue.

Get in touch